I’ve been dipping into another new book this week, “Transport Revolutions: Moving People and Freight without Oil” by Gilbert and Perl (both Canadians!). The section on energy has a graph that caught my eye, which is attributed to Kjell Aleklett, president of ASPO International. I couldn’t find the exact same graph online, but this is similar:
It shows a prediction, made back in 2002, that oil production would peak at 87 million barrels per day in 2010, and decline thereafter, according to the Hubbert Curve. What actually happened? Here’s the data from the the US Energy Information Administration:
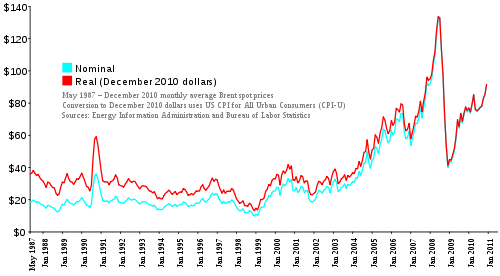
Which shows that since 2005, oil production has remained roughly constant, within a 4% band of 85 million barrels per day, with a slight peak in the summer of 2008. What happened in 2008? Well, both the book by Gilbert and Perl I mentioned above, and the Post-Carbon Reader (which I mentioned in my last post on peak oil) identify 2008 as the year when everything changed. And not because that was the year of the financial crisis, but because in the summer of 2008, oil prices suddenly surged to $150 per barrel, which in hindsight now looks like a major trigger of the financial crisis. It was, therefore, the first taste of what’s to come if oil production really has peaked.
Of course, the collapse of the economy in most of the developed world led to an immediate drop in demand for oil, and hence a corresponding drop in prices. But the upwards pressure on oil prices never went away. And here we are in February 2011, and prices are back up to $110 per barrel and heading higher:

Picking out cause and effect is a little tricky here. One could conclude that current high oil prices are caused by the unrest sweeping many of the oil producing nations of North Africa and the Middle East. A more sophisticated analysis says that while the popular uprising in these countries is due to a growing discontent with corrupt dictatorships, it was specifically triggered by a spike in food prices. When governments cannot feed their people, what might have been (barely) tolerable in the past suddenly becomes completely intolerable. And the spike in food prices? It’s due to the combination of sharply rising oil prices and climate-related disasters around the world that have hit food production simultaneously in many parts of the world.
What happens next? The International Energy Agency is speculating about another oil price shock this year:
Oil prices appear to be on their way up to the level we saw in 2008. Food prices are doing the same. The big worry is that this is no longer a temporary thing. Back in early January, before the latest spike in oil prices, Lester Brown predicted 2011 will be a year of food crises. So far he’s looking spot on.


I’m definitely a peak-oil kinda guy, at least in the weak form: it seems the lifecycle dynamics of production of a finite resource for which cost varies inversely with supply must be concave downward. That being said, at least WRT oil, cost of production is not the only determinant of market price. So I’m more than a little skeptical about reading too much into 2008, e.g.,
@sme: “[Gilbert and Perl 2010] and the Post-Carbon Reader […] identify 2008 as the year when everything changed. And not because that was the year of the financial crisis, but because in the summer of 2008, oil prices suddenly surged to $150 per barrel, [giving us] the first taste of what’s to come if oil production really has peaked.”
Perhaps I’m reading in a bit much, but that seems to claim that the 2008 oil price volatility was a function of peak-seeking or peak-reaching. No? If so, one must note:
2008 was also a year of rampant speculation in oil markets. This should seem intuitively reasonable when looking at ~70% excursion in the websitebuilding.biz oil price series for 2008: one immediately suspects neither supply nor demand changed that much or that rapidly. For a more sophisticated analysis, see Sornette et al 2009, “[supporting] the hypothesis that the [2008] oil price run-up, when expressed in any of the major currencies, has been amplified by speculative behavior of the type found during a bubble-like expansion. The underlying positive feedbacks, nucleated by rumors of rising scarcity, may result from one or several of the following factors acting together: (1) protective hedging against future oil price increases and a weakening dollar whose anticipations amplify hedging in a positive self-reinforcing loop; (2) search for a new high-return investment, following the collapse of real-estate, the securitization disaster and poor yields of equities, whose expectations, endorsed by a growing pool of hedge, pension and sovereign funds, will transform it in a self-fulfilling prophecy; (3) the recent development since 2006 of deregulated oil future trading, allowing spot oil price to be actually more and more determined by speculative future markets and thus more and more decoupled from genuine supply-demand equilibrium.”
Speculation does not, of course, affect the underlying, long-term demand and supply dynamics driving peak oil (by 2014 per Nashwari et al 2010). Speculation may also be affected by peak-seeking uncertainty (as exemplified by the “World Oil Supply according to EIA” series above). But bubblicious noise can famously swamp supply/demand signal in any market.