I’m at the AGU meeting in San Francisco this week. The internet connections in the meeting rooms suck, so I won’t be twittering much, but will try and blog any interesting talks. But first things first! I presented my poster in the session on “Methodologies of Climate Model Evaluation, Confirmation, and Interpretation” yesterday morning. Nice to get my presentation out of the way early, so I can enjoy the rest of the conference.

Here’s my poster, and the abstract is below (click for the full sized version at the AGU ePoster site):

A Hierarchical Systems Approach to Model Validation

Introduction

Discussions of how climate models should be evaluated tend to rely on either philosophical arguments about the status of models as scientific tools, or on empirical arguments about how well runs from a given model match observational data. These lead to quantitative measures expressed in terms of model bias or forecast skill, and ensemble approaches where models are assessed according to the extent to which the ensemble brackets the observational data.

Such approaches focus the evaluation on models per se (or more specifically, on the simulation runs they produce), as if the models can be isolated from their context. Such approaches may overlook a number of important aspects of the use of climate models:

  • the process by which models are selected and configured for a given scientific question.
  • the process by which model outputs are selected, aggregated and interpreted by a community of expertise in climatology.
  • the software fidelity of the models (i.e. whether the running code is actually doing what the modellers think it’s doing).
  • the (often convoluted) history that begat a given model, along with the modelling choices long embedded in the code.
  • variability in the scientific maturity of different components within a coupled earth system model.

These omissions mean that quantitative approaches cannot assess whether a model produces the right results for the wrong reasons, or conversely, the wrong results for the right reasons (where, say the observational data is problematic, or the model is configured to be unlike the earth system for a specific reason).

Furthermore, quantitative skill scores only assess specific versions of models, configured for specific ensembles of runs; they cannot reliably make any statements about other configurations built from the same code.

Quality as Fitness for Purpose

The problem is that there is no such thing as “the model”. The body of code that constitutes a modern climate model actually represents an enormous number of possible models, each corresponding to a different way of configuring that code for a particular run. Furthermore, this body of code isn’t a static thing. The code is changed on a daily basis, through a continual process of experimentation and model improvement. This applies even to any specific “official release”, which again is just a body of code that can be configured to run as any of a huge number of different models, and again, is not unchanging – as with all software, there will be occasional bugfix releases applied to it, along with improvements to the ancillary datasets.

Evaluation of climate models should not be about “the model”, but about the relationship between a modelling system and the purposes to which it is put. More precisely, it’s about the relationship between particular ways of building and configuring models and the ways in which the runs produced by those models are used.

What are the uses of a climate model? They vary tremendously:

  • To provide inputs to assessments of the current state of climate science;
  • To explore the consequences of a current theory;
  • To test a hypothesis about the observational system (e.g. forward modeling);
  • To test a hypothesis about the calculational system (e.g. to explore known weaknesses);
  • To provide homogenized datasets (e.g. re-analysis);
  • To conduct thought experiments about different climates;
  • To act as a comparator when debugging another model;

In general, we can distinguish three separate systems: the calculational system (the model code); the theoretical system (current understandings of climate processes) and the observational system. In the most general sense, climate models are developed to explore how well our current understanding (i.e. our theories) of climate explain the available observations. And of course the inverse: what additional observations might we make to help test our theories.

We’re dealing with relationships between three different systems

Validation of the Entire Modeling System

When we ask questions about likely future climate change, we don’t ask the question of the calculational system, we ask it of the theoretical system; the models are just a convenient way of probing the theory to provide answers.
When society asks climate scientists for future projections, the question is directed at climate scientists, not their models. Modellers apply their judgment to select appropriate versions & configurations of the models to use, set up the runs, and interpret the results in the light of what is known about the models’ strengths and weaknesses and about any gaps between the computational models and the current theoretical understanding. And they add all sorts of caveats to the conclusions they draw from the model runs when they present their results.

Validation is not a post-hoc process to be applied to an individual “finished” model, to ensure it meets some criteria for fidelity to the real world. In reality, there is no such thing as a finished model, just many different snapshots of a large set of model configurations, steadily evolving as the science progresses. Knowing something about the fidelity of a given model configuration to the real world is useful, but not sufficient to address fitness for purpose. For this, we have to assess the extent to which climate models match our current theories, and the extent to which the process of improving the models keeps up with theoretical advances.

Summary

Our approach to model validation extends current approaches:

  • down into the detailed codebase to explore the processes by which the code is built and tested. Thus, we build up a picture of the day-to-day practices by which modellers make small changes to the model and test the effect of such changes (both in isolated sections of code, and on the climatology of a full model). The extent to which these practices improve the confidence and understanding of the model depends on how systematically this testing process is applied, and how many of the broad range of possible types of testing are applied. We also look beyond testing to other software practices that improve trust in the code, including automated checking for conservation of mass across the coupled system, and various approaches to spin-up and restart testing.
  • up into the broader scientific context in which models are selected and used to explore theories and test hypotheses. Thus, we examine how features of the entire scientific enterprise improve (or impede) model validity, from the collection of observational data, creation of theories, use of these theories to develop models, choices for which model and which model configuration to use, choices for how to set up the runs, and interpretation of the results. We also look at how model inter-comparison projects provide a de facto benchmarking process, leading in turn to exchanges of ideas between modelling labs, and hence advances in the scientific maturity of the models.

This layered approach does not attempt to quantify model validity, but it can provide a systematic account of how the detailed practices involved in the development and use of climate models contribute to the quality of modelling systems and the scientific enterprise that they support. By making the relationships between these practices and model quality more explicit, we expect to identify specific strengths and weaknesses the modelling systems, particularly with respect to structural uncertainty in the models, and better characterize the “unknown unknowns”.

I’ve spent much of the last month preparing a major research proposal for the Ontario Research Fund (ORF), entitled “Integrated Decision Support for Sustainable Communities”. We’ve assembled a great research team, with professors from a number of different departments, across the schools of engineering, information, architecture, and arts and science. We’ve held meetings with a number of industrial companies involved in software for data analytics and 3D modeling, consultancy companies involved in urban planning and design, and people from both provincial and city government. We started putting this together in September, and were working to a proposal deadline at the end of January.

And then this week, out of the blue, the province announced that it was cancelling the funding program entirely, “in light of current fiscal challenges”. The best bit in the letter I received was:

The work being done by researchers in this province is recognized and valued. This announcement is not a reflection of the government’s continued commitment through other programs that provides support to the important work being done by researchers.

I’ve searched hard for the “other programs” they mention, but there don’t appear to be any. It’s increasingly hard to get any finding for research, especially trans-disciplinary research. Here’s the abstract from our proposal:

Our goal is to establish Ontario as a world leader in building sustainable communities, through the use of data analytics tools that provide decision-makers with a more complete understanding of how cities work. We will bring together existing expertise in data integration, systems analysis, modeling, and visualization to address the information needs of citizens and policy-makers who must come together to re-invent towns and cities as the basis for a liveable, resilient, carbon-neutral society. The program integrates the work of a team of world-class researchers, and builds on the advantages Ontario enjoys as an early adopter of smart grid technologies and open data initiatives.

The long-term sustainability of Ontario’s quality of life and economic prosperity depends on our ability to adopt new, transformative approaches to urban design and energy management. The transition to clean energy and the renewal of urban infrastructure must go hand-in-hand, to deliver improvements across a wide range of indicators, including design quality, innovation, lifestyle, transportation, energy efficiency and social justice. Design, planning and decision-making must incorporate a systems-of-systems view, to encompass the many processes that shape modern cities, and the complex interactions between them.

Our research program integrates emerging techniques in five theme areas that bridge the gap between decision-making processes for building sustainable cities and the vast sources of data on social demographics, energy, buildings, transport, food, water and waste:

  • Decision-Support and Public Engagement: We begin by analyzing the needs of different participants, and develop strategies for active engagement;
  • Visualization: We will create collaborative and immersive visualizations to enhance participatory decision-making;
  • Modelling and Simulation: We will develop a model integration framework to bring together models of different systems that define the spatio-temporal and socio-economic dynamics of cities, to drive our visualizations;
  • Data Privacy: We will assess the threats to privacy of all citizens that arise when detailed data about everyday activities is mined for patterns and identify appropriate techniques for protecting privacy when such data is used in the modeling and analysis process;
  • Data Integration and Management: We will identify access paths to the data sources needed to drive our simulations and visualizations, and incorporate techniques for managing and combining very large datasets.

These themes combine to provide an integrated approach to intelligent, data-driven planning and decision-making. We will apply the technologies we develop in a series of community-based design case studies, chosen to demonstrate how our approach would apply to increasingly complex problems such as energy efficiency, urban intensification, and transportation. Our goal is to show how an integrated approach can improve the quality and openness of the decision-making process, while taking into account the needs of diverse stakeholders, and the inter-dependencies between policy, governance, finance and sustainability in city planning.

Because urban regions throughout the world face many of the same challenges, this research will allow Ontario to develop a technological advantage in areas such as energy management and urban change, and enabling a new set of creative knowledge-based services address the needs of communities and governments. Ontario is well placed to develop this as a competitive advantage, due to its leadership in the collection and maintenance of large datasets in areas such as energy management, social well-being, and urban infrastructure. We will leverage this investment and create a world-class capability not available in any other jurisdiction.

Incidentally, we spent much of last fall preparing a similar proposal for the previous funding round. That was rejected on the basis that we weren’t clear enough what the project outcomes would be, and what the pathways to commercialization were. For our second crack at it, we were planning to focus much more specifically on the model integration part, by developing a software framework for coupling urban system models, based on a detailed requirements analysis of the stakeholders involved in urban design and planning, with case studies on neighbourhood re-design and building energy retro-fits. Our industrial partners have identified a number of routes to commercial services that would make use of such software. Everything was coming together beautifully. *Sigh*.

Now we have to find some other source of funding for this. Contributions welcome!

I went to a talk yesterday by Mark Pagani (Yale University), on the role of methane hydrates in the Paleocene-Eocene Thermal Maximum (PETM). The talk was focussed on how to explain the dramatic warming seen at the end of the Paleocene, 56 million years ago. During the Paleocene, the world was already much warmer than it is today (by around 5°C), and had been ice free for millions of years. But at the end of the Paleocene, the tempature shot up by at least another 5°C, over the course of a few thousand years, giving us a world with palm trees and crocodiles in the arctic, and this “thermal maximum” lasted around 100,000 years. The era brought a dramatic reduction in animal body size (although note: the dinosaurs had already been wiped out at the beginning of the Paleocene), and saw the emergence of small mammals.

But what explains the dramatic warming? The story is fascinating, involving many different lines of evidence, and I doubt I can do it justice without a lot more background reading. I’ll do a brief summary here, as I want to go on to talk about something that came up in the questions about climate sensitivity.

First, we know that the warming at the PETM coincided with a massive influx of carbon, and the fossil record shows a significant shift in carbon isotopes, so it was a new and different source of carbon. The resulting increase in CO2 warmed the planet in the way we would expect. But where did the carbon come from? The dominant hypothesis has been that it came from a sudden melting of undersea methane hydrates, triggered by tectonic shifts. But Mark explained that this hypothesis doesn’t add up, because there isn’t enough carbon to account for the observed shift in carbon isotopes, and it also requires a very high value for climate sensitivity (in the range 9-11°C), which is inconsistent with the IPCC estimates of 2-4.5ºC. Some have argued this is evidence that climate sensitivity really is much higher, or perhaps that our models are missing some significant amplifiers of warming (see for instance, the 2008 paper by Zeebe et al., which caused a ruckus in the media). But, as Mark pointed out, this really misses the key point. If the numbers are inconsistent with all the other evidence about climate sensitivity, then it’s more likely that the methane hydrates hypothesis itself is wrong. Mark’s preferred explanation is a melting of the antarctic permafrost, caused by a shift in orbital cycles, and indeed he demonstrates that the orbital pattern leads to similar spikes (of decreasing amplitude) throughout the Eocene. Prior to the PETM, Antarctica would have been ice free for so long that a substantial permafrost would have built up, and even conservative estimates based on today’s permafrost in the sub-arctic regions would have enough carbon to explain the observed changes. (Mark has a paper on this coming out soon).

That was very interesting, but for me the most interesting part was in the discussion at the end of the talk. Mark had used the term “earth system sensitivity” instead of “climate sensitivity”, and Dick Peltier suggested he should explain the distinction for the benefit of the audience.

Mark began by pointing out that the real scientific debate about climate change (after you discount the crazies) is around the actual value of climate sensitivity, which is shorthand for the relationship between changes in atmospheric concentrations of CO2 and the resulting change in global temperature:

Key relationships in the climate system. Adapted from a flickr image by ClimateSafety (click image for the original)

The term climate sensitivity was popularized in 1979 by the Charney report, and refers to the eventual temperature response to a doubling of CO2 concentrations, taking into account fast feedbacks such as water vapour, but not the slow feedbacks such as geological changes. Charney sensitivity also assumes everything else about the earth system (e.g. ice sheets, vegetation, ocean biogeochemistry, atmospheric chemistry, aerosols, etc) is held constant. The reason the definition refers to warming per doubling of CO2 is because the radiative effect of CO2 is roughly logarithmic, so you get about he same warming each time you double atmospheric concentrations. Charney calculated climate sensitivity to be 3°C (±1.5), a value that was first worked out in the 1950’s, and hasn’t really changed, despite decades of research since then. Note: equilibrium climate sensitivity is also not the same as the transient response.

Earth System Sensitivity is then the expected change in global temperature in response to a doubling of CO2 when we do take into account all the other aspects of the earth system. This is much harder to estimate, because there is a lot more uncertainty around different kinds of interactions in the earth system. However, many scientists expect it to be higher than the Charney sensitivity, because, on balance, most of the known earth system feedbacks are positive (i.e. they amplify the basic greenhouse gas warming).

Mark put it this way: Earth System Sensitivity is like an accordion. It stretches out or contracts, depending on the current state of the earth system. For example, if you melt the arctic sea ice, this causes an amplifying feedback because white ice has a higher albedo than the dark sea water that replaces it. So if there’s a lot of ice to melt, it would increase earth system sensitivity. But if you’ve already melted all the sea ice, the effect is gone. Similarly, if the warming leads to a massive drying out and burning of vegetation, that’s another temporary amplification that will cease once you’ve burned off most of the forests. If you start the doubling in a warmer world, in which these feedbacks are no longer available, earth system sensitivity might be lower.

The key point is that, unlike Charney sensitivity, earth system sensitivity depends on where you start from. In the case of the PETM, the starting point for the sudden warming was a world that was already ice free. So we shouldn’t expect the earth system sensitivity to be the same as it is in the 21st century. Which certainly complicates the job of comparing climate changes in the distant past with those of today.

But, more relevantly for current thinking about climate policy, thinking in terms of Charney sensitivity is likely to be misleading. If earth system sensitivity is significantly bigger in today’s earth system, which seems likely, then calculations of expected warming based on Charney sensitivity will underestimate the warming, and hence the underestimate the size of the necessary policy responses.

I’ll be giving a talk to the Toronto section of the IEEE Systems Council on December 1st, in which I plan to draw together several of the ideas I’ve been writing about recently on systems thinking and leverage points, and apply them to the problem of planetary boundaries. Come and join in the discussion if you’re around:

Who’s flying this ship? Systems Engineering for Planet Earth

Thurs, Dec 1, 2011, 12:00 p.m. – 1:00 p.m, Ryerson University (details and free registration here)

At the beginning of this month, the human population reached 7 billion people. The impact of humanity on the planet is vast: we use nearly 40% of the earth’s land surface to grow food, we’re driving other species to extinction at a rate not seen since the last ice age, and we’ve altered the planet’s energy balance by changing the atmosphere. In short, we’ve entered a new geological age, the Anthropocene, in which our collective actions will dramatically alter the inhabitability of the planet. We face an urgent task: we have to learn how to manage the earth as a giant system of systems, before we do irreparable damage. In this talk, I will describe some of the key systems that are relevant to this task, including climate change, agriculture, trade, energy production, and the global financial system. I will explore some of the interactions between these systems, and characterize the feedback cycles that alter their dynamics and affect their stability. This will lead us to an initial attempt to identify planetary boundaries for some of these systems, which together define a safe operating space for humanity. I will end the talk by offering a framework for thinking about the leverage points that may allow us to manage these systems to keep them within the safe operating limits.

I had several interesting conversations at WCRP11 last week about how different the various climate models are. The question is important because it gives some insight into how much an ensemble of different models captures the uncertainty in climate projections. Several speakers at WCRP suggested we need an international effort to build a new, best of breed climate model. For example, Christian Jakob argued that we need a “Manhattan project” to build a new, more modern climate model, rather than continuing to evolve our old ones (I’ve argued in the past that this is not a viable approach). There have also been calls for a new international climate modeling centre, with the resources to build much larger supercomputing facilities.

The counter-argument is that the current diversity in models is important, and re-allocating resources to a single centre would remove this benefit. Currently around 20 or so different labs around the world build their own climate models to participate in the model inter-comparison projects that form a key input to the IPCC assessments. Part of the argument for this diversity of models is that when different models give similar results, that boosts our confidence in those results, and when they give different results, the comparisons provide insights into how well we currently understand and can simulate the climate system. For assessment purposes, the spread of the models is often taken as a proxy for uncertainty, in the absence of any other way of calculating error bars for model projections.

But that raises a number of questions. How well do the current set of coupled climate models capture the uncertainty? How different are the models really? Do they all share similar biases? And can we characterize how model intercomparisons feed back into progress in improving the models? I think we’re starting to get interesting answers to the first two of these questions, while the last two are, I think, still unanswered.

First, then, is the question of representing uncertainty. There are, of course, a number of sources of uncertainty. [Note that ‘uncertainty’ here doesn’t mean ‘ignorance’ (a mistake often made by non-scientists); it means, roughly, how big should the error bars be when we make a forecast, or more usefully, what does the probability distribution look like for different climate outcomes?]. In climate projections, sources of uncertainty can be grouped into three types:

  • Internal variability: natural fluctuations in the climate (for example, the year-to-year differences caused by the El Niño Southern Oscillation, ENSO);
  • Scenario uncertainty: the uncertainty over future carbon emissions, land use changes, and other types of anthropogenic forcings. As we really don’t know how these will change year-by-year in the future (irrespective of whether any explicit policy targets are set), it’s hard to say exactly how much climate change we should expect.
  • Model uncertainty: the range of different responses to the same emissions scenario given by different models. Such differences arise, presumably, because we don’t understand all the relevant processes in the climate system perfectly. This is the kind of uncertainty that a large ensemble of different models ought to be able to assess.

Hawkins and Sutton analyzed the impact of these different type of uncertainty on projections of global temperature over the range of a century. Here, Fractional Uncertainty means the ratio of the model spread to the projected temperature change (against a 1971-2000 mean):

This analysis shows that for short term (decadal) projections, the internal variability is significant. Finding ways of reducing this (for example by better model initialization from the current state of the climate) is important the kind of near-term regional projections needed by, for example, city planners, and utility and insurance companies, etc. Hawkins & Sutton indicate with dashed lines some potential to reduce this uncertainty for decadal projections through better initialization of the models.

For longer term (century) projections, internal variability is dwarfed by scenario uncertainty. However, if we’re clear about the nature of the scenarios used, we can put scenario uncertainty aside and treat model runs as “what-if” explorations – if the emissions follow a particular pathway over the 21st Century, what climate response might we expect?

Model uncertainty remains significant over both short and long term projections. The important question here for predicting climate change is how much of this range of different model responses captures the real uncertainties in the science itself. In the analysis above, the variability due to model differences is about 1/4 of the magnitude of the mean temperature rise projected for the end of the century. For example, if a given emissions scenario leads to a model mean of +4°C, the model spread would be about 1°C, yielding a projection of +4±0.5°C. So is that the right size for an error bar on our end-of-century temperature projections? Or, to turn the question around, what is the probability of a surprise – where the climate change turns out to fall outside the range represented by the current model ensemble?

Just as importantly, is the model ensemble mean the most likely outcome? Or do the models share certain biases so that the truth is somewhere other than the multi-model mean? Last year, James Annan demolished the idea that the models cluster around the truth, and in a paper with Julia Hargreaves, provides some evidence that the model ensembles do a relatively good job of bracketing the observational data, and, if anything, the ensemble spread is too broad. If the latter point is correct, then the model ensembles over-estimate the uncertainty.

This brings me to the question of how different the models really are. Over the summer, Kaitlin Alexander worked with me to explore the software architecture of some of the models that I’ve worked with from Europe and N. America. The first thing that jumped out at me when she showed me her diagrams was how different the models all look from one another. Here are six of them presented side-by-side. The coloured ovals indicate the size (in lines of code) of each major model component (relative to other components in the same model; the different models are not shown to scale), and the coloured arrows indicate data exchanges between the major components (see Kaitlin’s post for more details):

There are clearly differences in how the components are coupled together (for example, whether all data exchanges pass through a coupler, or whether components interact directly). In some cases, major subcomponents are embedded as subroutines within a model component, which makes the architecture harder to understand, but may make sense from a scientific point of view, when earth system processes themselves are tightly coupled. However, such differences in the code might just be superficial, as the choice of call structure should not, in principle affect the climatology.

The other significant difference is in the relative sizes of the major components. Lines of code isn’t necessarily a reliable measure, but it usually offers a reasonable proxy for the amount of functionality. So a model with an atmosphere model dramatically bigger than the other components indicates a model for which far more work (and hence far more science) has gone into modeling the atmosphere than the other components.

Compare for example, the relative sizes of the atmosphere and ocean components for HadGEM3 and IPSLCM5A, which, incidentally, both use the same ocean model, NEMO. HadGEMs has a much bigger atmosphere model, representing more science, or at least many more options for different configurations. In part, this is because the UK Met Office is an operational weather forecasting centre, and the code base is shared between NWP and climate research. Daily use of this model for weather forecasting offers many opportunities to improve the skill of the model (although improvement in skill in short term weather forecasting doesn’t necessarily imply improvements in skill for climate simulations). However, the atmosphere model is the biggest beneficiary of this process, and, in fact, the UK Met Office does not have much expertise in ocean modeling. In contrast, the IPSL model is the result of a collaboration between several similarly sized research groups, representing different earth subsystems.

But do these architectural differences show up as scientific differences? I think they do, but was finding this hard to analyze. Then I had a fascinating conversation at WCRP last week with Reto Knutti, who showed me a recent paper that he published with D. Masson, in which they analyzed model similarity from across the CMIP3 dataset. The paper describes a cluster analysis over all the CMIP3 models (plus three re-analysis datasets, to represent observations), based on how well the capture the full spatial field for temperature (on the left) and precipitation (on the right). The cluster diagrams look like this (click for bigger):

In these diagrams, the models from the same lab are coloured the same. Observational data are in pale blue (three observational datasets were included for temperature, and two for precipitation). Some obvious things jump out: the different observational datasets are more similar to each other than they are to any other model, but as a cluster, they don’t look any different from the models. Interestingly, models from the same lab tend to be more similar to one another, even when these span different model generations. For example, for temperature, the UK Met Office models HadCM3 and HadGEM1 are more like each other than they are like any other models, even though they run at very different resolutions, and have different ocean models. For precipitation, all the GISS models cluster together and are quite different from all the other models.

The overall conclusion from this analysis is that using models from just one lab (even in very different configurations, and across model generations) gives you a lot less variability than using models from different labs. Which does suggest that there’s something in the architectural choices made at each lab that leads to a difference in the climatology. In the paper, Masson & Knutti go on to analyze perturbed physics ensembles, and show that the same effect shows up here too. Taking a single model, and systematically varying the parameters used in the model physics still gives you less variability than using models from different labs.

There’s another followup question that I would like to analyze: do models that share major components tend to cluster together? There’s a growing tendency for a given component (e.g. an ocean model, an atmosphere model) to show up in more than one lab’s GCM. It’s not yet clear how this affects variability in a multi-model ensemble.

So what are the lessons here? First, there is evidence that the use of multi-model ensembles is valuable and important, and that these ensembles capture the uncertainty much better than multiple runs of a single model (no matter how it is perturbed). The evidence suggests that models from different labs are significantly different from one another both scientifically and structurally, and at least part of the explanation for this is that labs tend to have different clusters of expertise across the full range of earth system processes. Studies that compare model results with observational data (E.g. Hargreaves & Annan; Masson & Knutti) show that the observations looks no different from just another member of the multi-model ensemble (or to put it in Annan and Hargreaves’ terms, the truth is statistically indistinguishable from another model in the ensemble).

It would appear that the current arrangement of twenty or so different labs competing to build their own models is a remarkably robust approach to capturing the full range of scientific uncertainty with respect to climate processes. And hence it doesn’t make sense to attempt to consolidate this effort into one international lab.

One of the questions I’ve been chatting to people about this week at the WCRP Open Science Conference this week is whether climate modelling needs to be reorganized as an operational service, rather than as a scientific activity. The two respond to quite different goals, and hence would be organized very differently:

  • An operational modelling centre would prioritize stability and robustness of the code base, and focus on supporting the needs of (non-scientist) end-users who want models and model results.
  • A scientific modelling centre focusses on supporting scientists themselves as users. The key priority here is to support the scientists’ need to get their latest ideas into the code, to run experiments and get data ready to support publication of new results. (This is what most climate modeling centres do right now).

Both need good software practices, but those practices would look very different in the case when the scientists are building code for their own experiments, versus serving the needs of other communities. There are also very different resource implications: an operational centre that serves the needs of a much more diverse set of stakeholders would need a much larger engineering support team in relation to the scientific team.

The question seems very relevant to the conference this week, as one of the running themes has been the question of what “climate services” might look like. Many of the speakers call for “actionable science”, and there has been a lot of discussion of how scientists should work with various communities who need knowledge about climate to inform their decision-making.

And there’s clearly a gap here, with lots of criticism of how it works at the moment. For example, here’s a great from Bruce Hewitson on the current state of climate information:

“A proliferation of portals and data sets, developed with mixed motivations, with poorly articulated uncertainties and weakly explained assumptions and dependencies, the data implied as information, displayed through confusing materials, hard to find or access, written in opaque language, and communicated by interface organizations only semi‐aware of the nuances, to a user community poorly equipped to understand the information limitations”

I can’t argue with any of that. But it begs the question as to whether solving this problem requires a reconceptualization of climate modeling activities to make them much more like operational weather forecasting centres?

Most of the people I spoke to this week think that’s the wrong paradigm. In weather forecasting, the numerical models play a central role, and become the workhorse for service provision. The models are run every day, to supply all sorts of different types of forecasts to a variety of stakeholders. Sure, a weather forecasting service also needs to provide expertise to interpret model runs (and of course, also needs a vast data collection infrastructure to feed the models with observations). But in all of this, the models are absolutely central.

In contrast, for climate services, the models are unlikely to play such a central role. Take for example, the century-long runs, such as those used in the IPCC assessments. One might think that these model runs represent an “operational service” provided to the IPCC as an external customer. But this is a fundamentally mistaken view of what the IPCC is and what it does. The IPCC is really just the scientific community itself, reviewing and assessing the current state of the science. The CMIP5 model runs currently being done in preparation for the next IPCC assessment report, AR5, are conducted by, and for, the science community itself. Hence, these runs have to come from science labs working at the cutting edge of earth system modelling. An operational centre one step removed from the leading science would not be able to provide what the IPCC needs.

One can criticize the IPCC for not doing enough to translate the scientific knowledge into something that’s “actionable” for different communities that need such knowledge. But that criticism isn’t really about the modeling effort (e.g. the CMIP5 runs) that contributes to the Working Group 1 reports. It’s about how the implications of the working group 1 translate into useful information in working groups 2 and 3.

The stakeholders who need climate services won’t be interested in century-long runs. At most they’re interest in decadal forecasts (a task that is itself still in it’s infancy, and a long way from being ready for operational forecasting). More often, they will want help interpreting observational data and trends, and assessing impacts on health, infrastructure, ecosystems, agriculture, water, etc. While such services might make use of data from climate model runs, it generally involve run models regularly in an operational mode. Instead the needs would be more focussed on downscaling the outputs from existing model run datasets. And sitting somewhere between current weather forecasting and long term climate projections is the need for seasonal forecasts and regional analysis of trends, attribution of extreme events, and so on.

So I don’t think it makes sense for climate modelling labs to move towards an operational modelling capability. Climate modeling centres will continue to focus primarily on developing models for use within the scientific community itself. Organizations that provide climate services might need to develop their own modelling capability, focussed more on high resolution, short term (decadal or shorter) regional modelling, and of course, on assessment models that explore the interaction of socio-economic factors and policy choices. Such assessment models would make use of basic climate data from global circulation models (for example, calculations of climate sensitivity, and spatial distributions of temperature change), but don’t connect directly with climate modeling.

This week, I presented our poster on Benchmarking and Assessment of Homogenisation Algorithms for the International Surface Temperature Initiative (ISTI) at the WCRP Open Science Conference (click on the poster for a readable version).

This work is part of the International Surface Temperature Initiative (ISTI) that I blogged about last year. The intent is to create a new open access database for historial surface temperature records at a much higher resolution than has previously been available. In the past, only monthly averages were widely available; daily and sub-daily observations collected by meteorological services around the world are often considered commercially valuable, and hence tend to be hard to obtain. And if you go back far enough, much of the data was never digitized and some is held in deteriorating archives.

The goal of the benchmarking part of the project is to assess the effectiveness of the tools used to remove data errors from the raw temperature records. My interest in this part of the project stems from the work that my student, Susan Sim, did a few years ago on the role of benchmarking to advance research in software engineering. Susan’s PhD thesis described a theory that explains why benchmarking efforts tend to accelerate progress within a research community. The main idea is that creating a benchmark brings the community together to build consensus on what the key research problem is, what sample tasks are appropriate to show progress, and what metrics should be used to measure that progress. The benchmark then embodies this consensus, allowing different research groups to do detailed comparisons of their techniques, and facilitating sharing of approaches that work well.

Of course, it’s not all roses. Developing a benchmark in the first place is hard, and requires participation from across the community; a benchmark put forward by a single research group is unlikely to accepted as unbiased by other groups. This also means that a research community has to be sufficiently mature in terms of their collaborative relationships and consensus on common research problems (in Kuhnian terms, they must be in the normal science phase). Also, note that a benchmark is anchored to a particular stage of the research, as it captures problems that are currently challenging; continued use of a benchmark after a few years can lead to a degeneration of the research, with groups over-fitting to the benchmark, rather than moving on to harder challenges. Hence, it’s important to retire a benchmark every few years and replace it with a new one.

The benchmarks we’re exploring for the ISTI project are intended to evaluate homogenization algorithms. These algorithms detect and remove artifacts in the data that are due to things that have nothing to do with climate – for example when instruments designed to collect short-term weather data don’t give consistent results over the long-term record. The technical term for these is inhomogeneities, but I’ll try to avoid the word, not least because I find it hard to say. I’d like to call them anomalies, but that word is already used in this field to mean differences in temperature due to climate change. Which means that anomalies and inhomogeneities are, in some ways, opposites: anomalies are the long term warming signal that we’re trying to assess, and inhomogeneities represent data noise that we have to get rid of first. I think I’ll just call them bad data.

Bad data arise for a number of reasons, usually isolated to changes at individual recording stations: a change of instruments, an instrument drifting out of calibration, a re-siting, a slow encroachment of urbanization which changes the local micro-climate. Because these problems tend to be localized, they can often be detected by statistical algorithms that compare individual stations with their neighbours. In essence, the algorithms look for step changes and spurious trends in the data such as the following:

These bad data are a serious problem in climate science – for a recent example, see the post yesterday at RealClimate, which discusses how homogenization algorithms might have gotten in the way of understanding the relationship between climate change and the Russian heatwave of 2010. Unhelpfully, they’re also used by deniers to beat up climate scientists, as some people latched onto the idea of blaming warming trends on bad data rather than, say, actual warming. Of course, this ignores two facts: (1) climate scientists already spend a lot of time assessing and removing such bad data and (2) independent analysis has repeatedly shown that the global warming signal is robust with respect to such data problems.

However, such problems in the data still matter for the detailed regional assessments that we’ll need in the near future for identifying vulnerabilities (e.g. to extreme weather), and, as the example at RealClimate shows, for attribution studies for localized weather events and hence for decision-making on local and regional adaptation to climate change.

The challenge is that it’s hard to test how well homogenization algorithms work, because we don’t have access to the truth – the actual temperatures that the observational records should have recorded. The ISTI benchmarking project aims to fill this gap by creating a data set that has been seeded with artificial errors. The approach reminds me of the software engineering technique of bug seeding (aka mutation testing), which deliberately introduce errors into software to assess how good the test suite is at detecting them.

The first challenge is where to get a “clean” temperature record to start with, because the assessment is much easier if the only bad data in the sample are the ones we deliberately seeded. The technique we’re exploring is to start with the output of a Global Climate Model (GCM), which is probably the closest we can get to a globally consistent temperature record. The GCM output is on a regular grid, and may not always match the observational temperature record in terms of means and variances. So to make it as realistic as possible, we have to downscale the gridded data to yield a set of “station records” that match the location of real observational stations, and adjust the means and variances to match the real-world:

Then we inject the errors. Of course, the error profile we use is based on what we currently know about typical kinds of bad data in surface temperature records. It’s always possible there are other types of error in the raw data that we don’t yet know about; that’s one of the reasons for planning to retire the benchmark periodically and replace it with a new one – it allows new findings about error profiles to be incorporated.

Once the benchmark is created, it will be used within the community to assess different homogenization algorithms. Initially, the actual injected error profile will be kept secret, to ensure the assessment is honest. Towards the end of the 3-year benchmarking cycle, we will release the details about the injected errors, to allow different research groups to measure how well they did. Details of the results will then be included in the ISTI dataset for any data products that use the homogenization algorithms, so that users of these data products have more accurate estimates of uncertainty in the temperature record. Such estimates are important, because use of the processed data without a quantification of uncertainty can lead to misleading or incorrect research.

For more details of the project, see the Benchmarking and Assessment Working Group website, and the group blog.

How would you like to help the weather and climate research community digitize historical records before they’re lost forever to a fate such as this:

Watch this video, from the International Surface Temperature Initiative‘s data rescue initiative for more background (skip to around 2:20 for the interesting parts):

…and then get involved with the Data Rescue at Home Projects:

Our specialissue of IEEE Software, for Nov/Dec 2011, is out! The title for the issue is Climate Change: Science and Software, and the guest editors were me, Paul Edward, Balaji, and Reinhard Budich.

There’s a great editorial by Forrest Shull, reflecting on interviews he conducted with Robert Jacob at Argonne National Labs and Gavin Schmidt at NASA GISS. The papers in the issue are:

Unfortunately most of the content is behind a paywall, although you can read our guest editors introduction in full here. I’m working on making some of the other content more freely available too.

This is really last week’s news, but I practice slow science. A new web magazine has launched: Planet3.org.

The aim is to cover more in-depth analysis of climate change & sustainability, to get away from the usual false dichotomy between “deniers” and “activists”, and more into the question of what kind of future we’d like, and how we get there. Constructive, science-based discussions are welcome, and will be moderated to ensure the discussion threads are worth reading. The site also features a “best of the blogs” feed, and we’re experimenting with models for open peer-review for the more in-depth articles. And as an experimental collaborative project, there’s an ongoing discussion on how to build a community portal.

I’m proud to serve on the scientific review panel, and delighted that my essay on leverage points has been the main featured article this week.

Go check out the site and join in the discussions!

I spent some time yesterday exploring the Occupy Toronto happening in St James’ Park, and snapping photos. There’s something wonderful about the atmosphere there – one that makes me more optimistic for the future:

The place was a hive of activity. One of the things that impressed me the most was the organization that’s gone into it. There’s a medical tent (with a sign requesting no photos), a media tent (with free wifi):

an open library with an extensive set of books:

a makeshift kitchen:

…and the all important whiteboard listing what’s needed:

It was my first time seeing the human mic in action, and I was blown away by how that works as a community-building exercise.

And definitely kid-friendly:

And unlike most political rallies that feature celebrity speakers, this is entirely a grassroots affair. There’s some people down there who are brilliant at building the quiet, open atmosphere that’s conducive to community building.

And plenty of fun to be had doing sign writing:

Some of the signs had a strong Canadian theme. Our mayor (Rob Ford) features in many of them – for the non-locals, we have a ridiculously over the top right-wing mayor who tried to slash spending for everything from libraries to daycare this summer, and got a serious comeuppance from the citizenry in response. That’s him, on the orange sign below, being mocked for his election slogan that he would clear out the “gravy” from city hall (his consultants’ report showed the city is run very efficiently, and there is no gravy!). Oh, look, and right next to it, a Climate Justice sign:

Interestingly, the signs focus on sustainability just as much as economics. Here’s on that combines both themes very nicely:

And of course, plenty of artistic talent:

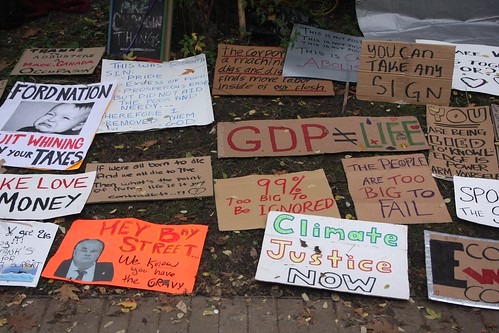
What unites both the climate crisis and the financial crisis? What is it that has driven scientists and environmentalists to risk arrest in protests across the world? What is it that’s driven people from all walks of life to show up in their thousands to occupy their cities? In both cases, there’s a growing sense that the system is fundamentally broken, and that our current political elites are unable (rather than just unwilling) to fix them. And in both cases, it’s becoming increasingly apparent that our current political system is a major cause of the problems. Which therefore makes it even harder to discover solutions.

So how do we make progress? If we’re going to take seriously the problems that have led people to take to the streets, then we have to understand the processes that are steadily driving us in the wrong direction when it comes to things we care about – a clean environment, a stable climate, secure jobs, a stable economy. In other words, we have to understand the underlying systems, understand the dynamics within those systems, and we have to find the right leverage points that would allow us to change those dynamics to work the way we would like.

Failure to take a systems view is evident throughout discussions of climate change, and now, more recently, throughout mainstream media discussions about the Occupy protests. Suggestions for what needs fixing tend to focus on superficial aspects of the systems that matter, mainly by tinkering with parameters (emissions targets, stabilization wedges, the size of the debt, the bank interest rate, etc). If the system itself is broken, you can’t fix it by adjusting its current parameters – you have to look at the underlying dynamics and change the structure of the system that gave rise to the problem in the first place. Most people are focusing on the wrong leverage points. Even worse, in some cases, they are pushing in the wrong direction on some of the leverage points…

Perhaps the best analysis of this I’ve ever seen is Donella Meadows’ essay on leverage points. [If you’re not already familiar with it, I highly recommend reading it before tackling the rest of this post]. Meadows has written some wonderfully accessible material on systems thinking, but only gives a very brief overview in this particular essay, because she’s focussing here on how to identify leverage points that allow one to alter a system. She identifies twelve places to look, and orders them, roughly, from the least effective to the most effective.

To illustrate the point, I’ll begin with a much simpler system than the ones we really want to fix. My example is the controllability of water temperature in a shower. The particular shower I have in mind is in a small hotel in Paris, and is a little antiquated, the result of old-fashioned plumbing. It takes time for the hot water to reach the shower head from the hot water tank, and there’s enough of a delay between the taps that control the hot and cold water and the temperature response, that you’re forever trying to adjust it to get a good temperature. It’s too cold, so you turn up the hot tap. The temperature barely seems to change, so you crank it up a lot. After a few minutes the water heats up so much it’s scalding. So you crank up the cold tap. Again, the temperature responds slowly until you realise it’s now too cold. You turn down the cold tap, and soon find it’s too hot again. And so on.

Does this remind you of the economy? Or, for that matter, the way the physical climate system works over the course of tens of thousands of years? More worryingly, it’s the outcome I expect if we ever try to geo-engineer our way out of extreme climate change. Right now, the human race is cranking up the hot tap. But the system responds very slowly. And by the time we’ve realized the heat has built up, we’ll have overshot our comfort zones. We’ll slam on the brakes and end up overcompensating. Because the system is just as hard to control (actually, a damn sight harder!) than that annoying shower in Paris.

Let’s look at how Meadows’ twelve leverage points might help us analyze the Parisian shower. At #12, we have what is usually the least effective place to seek change:

#12 Changes in constants, parameters, numbers. Example: Change the set point on the water tank thermostat. In general, such adjustments make no difference to the controllability of the shower. [There is an interesting exception, when we’re prepared to make really big adjustments. For example, if we crank the thermostat on the hot water tank all the way down to ‘pleasantly warm’ we’ll never have to balance the hot and cold taps again, we can just use the “hot” tap. Usually, such really big adjustments are unlikely to be made, for other reasons].

#11. Change the sizes of buffers and stocks relative to their flows. Example: Get a bigger hot water tank. This will make the energy bills bigger, but still won’t make the shower any more controllable.

#10. Change the structure of material stocks and flows. Example: Replace the water pipes with smaller diameter pipes. This might help, as it reduces the thermal mass of the pipes, and hence, may affect the lag between the water tank and the shower, leading to more responsive shower controls.

#9. Change the length of delays, relative to rate of system change. Example: Relocate the hot water tank closer to the bathroom; or Wait a little longer for temperature response to settle before touching the taps again. Such changes might be hard to achieve (hence they’re high up on the list), but very effective if we could do them.

#8. Increase the strength of negative feedback loops relative to the impacts they try to correct against. Example: Take a deep breath and calm down – you’re the negative feedback trying to keep the system stable. If you’re less impulsive on the taps, you’ll help to dampen the temperature fluctuations. If the system is changing too quickly, or is subject to instability, identifying the negative feedbacks, and working to strengthen them can often yield simple and effective leverage points. But when you’re in the shower getting scalded, it might be hard to remember this.

#7. Reduce the gain around positive feedback loops. Example: Replace the taps with ones that offer a finer level of control. This reduces the big temperature fluctuations when we turn the taps too quickly, and hence reduces the positive feedback loop that leads to temperature overshoot.

#6. Change the structure of information flows, to alter who does (or does not) have access to information. Example: Put an adjustable marker on the shower dial to record a preferred setting. Changing the flows of information about a system is generally much easier and cheaper than changing any other aspect of a system, hence, it’s often a more powerful leverage point than any of the above. For the shower, this one tiny fix may entirely cure the temperature fluctuation problem.

#5. Change the rules of the system (incentives, punishments, constraints). Example: Set limits on amount of time you can shower for. This might reduce the incentive to spend time fiddling with the temperature controls. But who will enforce the constraint?

#4. Nurture the power to add, change, evolve or self-organize system structure. Example: Teach yourself to tolerate a wider range of shower temperatures. or: Design a new automated temperature controller.

#3. Change the goal of the system. Example: Focus on getting clean quickly rather than getting the water to exactly the desired temperature. Of course, changing the goal of the system is hard, because it means changing people’s perceptions of the system itself.

#2. Change the mindset or paradigm out of which the system arises. Example: Is cleanliness over-rated? or: why stay in these antiquated hotels in Paris anyway? Paradigm shifts are hard to achieve, but when they happen, they have a dramatic transformative effect on the systems that arose in the previous paradigm.

#1. The power to transcend paradigms. Example: Learn systems thinking and gain the ability to understand a system from multiple perspectives; Realise that system structure and behaviour arises from the dominant paradigm; Explore how our own perspectives shape our interactions with the system.

Note that Meadows emphasizes the point that all twelve types of leverage point can be effective for changing systems, if you have a good understanding of how the system works, and can make good choices for where to make changes. However, in a self-perpectuating system, the dynamics that created the problem you’re trying to solve will also tend to defeat most kinds of change, unless they really do alter those dynamics in an important way.

Note that for many of these examples, I’ve chosen to include the person in the shower as part of my ‘shower system’. More importantly, some of my suggestions refer to how the person in the shower understands the shower system, and how her understanding of the system affects the system’s behaviour. This is to emphasize a mistake we often make when thinking about both the climate and the economy. In both cases, we have to understand the role that people play within these systems, and especially how our expectations and cultural norms themselves form part of the system. If people, in general, have the wrong mental model of how the systems work, it’s significantly more challenging to figure out how to fix things when they go wrong.

Let’s look at how the list of leverage points applies to the climate system and the financial system.

#12 Changes in Constants, parameters, numbers.

  • Climate System: tighten pollution standards, negotiate stronger version of the Kyoto protocol, increase fuel taxes, etc.
  • Financial System: change the interest base rates, increase size of stimulus spending, increase taxes, cut government spending, put caps on campaign contributions, increase the minimum wage, vote for the other party.

While changing the parameters of the existing system can make a difference, it’s rare that it does. Systems tend to operate in regions where small parameter adjustments make no difference to the overall stability of the system. If there’s a systemic effect that is pushing a system in the wrong direction (dependence on fossil fuels, financial instability, poverty, etc), then adjusting the system’s parameters is unlikely to make much difference, if you don’t also change the structure of the system.

None of these examples are likely to make much difference to the underlying problems. To understand this point, you have to understand the system you’re dealing with. For example, the whole problem of climate change itself might appear to be the result of a small parameter change – a small increase in radiative forcing, caused by a small increase (measured in parts per million!) in atmospheric concentrations of certain gases. But that’s not the real cause. The real cause is a systemic change in human activity that traces back to the industrial revolution: a new source of energy was harnessed, which then kicked off mutually reinforcing positive feedback loops in human population growth and energy use. A few more parts per million of CO2 in the atmosphere is not the problem; the problem is a new exponential trend that did not exist previously.

However, remember there’s sometimes an exception, if you make very large adjustments. For the climate system, you could increase fuel taxes so that gas (petrol) costs, say, ten times as much as it does today. Such an adjustment would be guaranteed to change the system (but not perhaps, when the mobs are done with you, in the way you intended). Here’s an interesting rule of thumb: if you change any parameter in a system by an order of magnitude or more, what you get is an entirely different type of system. Try it: a twenty-storey building is fundamentally different from a 2-storey house. A ten-lane freeway is fundamentally different from a single lane road. A salary of $1 million is fundamentally different from a salary of $100K.

#11. Change the sizes of buffers and stocks relative to their flows

  • Climate System: Plant more forests to create bigger carbon sinks. Ocean fertilization and/or artificial trees to soak up carbon, etc.
  • Financial System: Increase the federal reserve, require banks to hold larger reserves, increase debt ceiling limits.

In many systems these are hard to change, as they require large investments in infrastructure (the canonical example is a large dam to create a buffer in the water supply). This also means it can be hard to make frequent, fine-grained adjustments. More importantly, they tie up resources – keeping a large stock means that the stock isn’t working for you: your bigger water tank will make your energy bills much higher (and won’t affect your shower adjustment problem anyway). Making banks keep larger reserves will make them much less dynamic, and will reduce the funds available for lending.

All of these things might ease the problem a little, but none of them will make any significant difference to the cause of the problem. No matter how big you make the reserves, you’ll quickly be defeated by the exponential growth curves that you didn’t tackle.

#10. Change the structure of material stocks and flows

  • Climate System: Carbon Capture and Storage (diverts emissions at the point they are generated, so they don’t enter the atmosphere).
  • Financial System: Create a Tobin tax, which diverts a small percentage of each financial transaction to create a new pool of money to fix problems. Create new kinds of super-tax on the very rich. Separate the high street banks from their gambling investment operations.

Physical structure is also, usually, very hard to change, once the system is operating, although it’s sometimes easier to change how things flow than it is to create new buffers. However, both types of change tend to have limited impact, because the stocks and flows arise from the nature of the system – which means the system itself will find ways of defeating your efforts, for the same reason it ended up like it is now.

For example, separating high street banks from investment firms won’t really achieve much. People will find other ways to gamble bank money on foolish investments, if you haven’t actually addressed the reasons why such investments are made in the first place. Similarly for carbon capture and storage — diverting some percentage of the carbon that would go into the atmosphere via (expensive) CCS won’t help if our use of fossil fuels continues to grow at the rate it has done in the past. The fundamental problem of exponential growth in fossil fuel use will always outstrip our attempts to sequester some of it. There’s also the problem that on the timescales that matter (decades to centuries), it’s not clear the carbon will stay put. Oh, and CCS is only ever likely to be feasible on large, static sites like big power plants, so won’t make any different to emissions from transport, aviation, agriculture, etc.

#9. Change the length of delays, relative to rate of system change

  • Climate System: Speed up widescale deployment of clean energy technologies. Speed up the legislative process for climate policy. Speed up implementation of new standards for emissions. Use a faster ramp up on carbon pricing. Lengthen the approval process for new fossil fuel plants, oil pipelines, etc.
  • Financial System: Lengthen the approval process for risky loans, mergers, etc. Speed up implementation of government jobs programs. Slow down economic growth (to remove the boom and bust cycles).

Often, these kinds of change can be very powerful leverage points, but many of the delays in large systems are impossible to shorten – things take as long as they take. Also, as Meadows points out, most people try to shift things in the wrong direction, as many of these changes are counter-intuitive. For example, reducing the delay in money transfer times just increases chance of wild gyrations in the markets. Governments around the world usually seek to maximize economic growth, when often they should be trying to dampen it.

#8. Increase the strength of negative feedback loops relative to the impacts they try to correct against.

  • Climate System: Make the price of all goods reflect their true environmental cost. Remove perverse subsidies to fossil fuel companies (the cost of extraction & processing should be a negative feedback loop on dependence on fossil fuels); introduce better monitoring and data collection for global carbon fluxs, to more quickly assess impacts of different actions.
  • Financial System: More transparent democracy to allow people to vote out corrupt politicians more quickly; Remove subsidies, bailouts, etc (these distort the negative feedbacks that keep the financial system stable); protection for whistleblowers; more scrutiny of boardroom pay rises by unions and shareholders.

Negative feedbacks are what tend to keep a system stable. If the system is changing too quickly, or is subject to instability, identifying the negative feedbacks, and working to strengthen them, can often yield simple and effective leverage points. All of the examples here a likely to be more effective at fixing the respective systems than anything we’ve mentioned so far. Some of them rely on people acting as negative feedbacks. For example, by offering better protection for whistleblowers, you create a culture in which the people are less likely yield to corrupting influences.

#7. Reduce the gain around positive feedback loops

  • Climate System: Higher energy efficiency standards (this dampens the growth in energy demand); Green development – mechanisms that allow people to improve their quality of life without needing to increase their use of fossil fuels; wider use of birth control to curb population increases.
  • Financial System: Punish bankers who make reckless investment decisions (discourages others from following suit). Use a more progressive tax structure and introduce very high inheritance taxes (these prevent the rich from getting ever richer). High quality & free public education (to prevent the rich from forming privileged elites). Forgive all student loans on graduation (ends the cycle of individual indebtedness)
  • Both Systems: Slower economic growth (above, I described this as a “length of delay” issue – as slower growth can allow other processes, such as clean energy technology to keep up; but more importantly, economic growth is itself a positive feedback loop that drives ever more resource consumption, financial fluctuations and environmental degradation.

Runaway feedback loops inevitably destroy a system, unless some negative feedback loops kick in. In the long run, a negative feedback always kicks in: we use up all the resources, we kill off most of the population, we bankrupt everyone. But by that time the system has already been destroyed. The trick is to dampen the positive feedbacks long before too much damage is done, and this is often much more effective than trying to boost the strength of countervailing negative feedbacks. For example, if we want to address inequality, using tax structures that stop the rich getting ever richer is much more effective than creating anti-poverty programs aimed at mopping up the resulting inequalities.

Economic growth is an important example here. Remember that economic growth is a measure of the change in GDP over time. And GDP itself is a measure of the volume of financial transactions, or in other words, how fast money is flowing through the system. Accelerating these money flows makes all the instabilities in the financial system much worse. Worse still, one of the primary ways that GDP grows is by ever accelerating consumption of resources, so you get a self-reinforcing positive feedback loop between over-consumption and economic growth.

#6. Change the structure of information flows, to alter who does (or does not) have access to information

  • Climate System: Get IPCC assessment results out to the public faster, and in more accessible formats. Put journalists in touch with climate scientists. Label products with lifecycle carbon footprint data. Put meters in cars showing the total cost of each journey.
  • Financial System: Publish pay and benefit rates for all employees of private companies. Publish details of all political donations. Increase government oversight of financial transactions.
  • Both Systems: Open access to data, e.g. on campaign financing, carbon emissions, etc; Require all lobbyists and think tanks to publish full details on funding sources.

Changing the flows of information about a system is generally much easier and cheaper than changing any other aspect of a system, which means these can be very powerful leverage points. Many of these examples are powerful enough to cause significant changes to the underlying behaviour in the system, because they expose problems to the people that shape the behaviour of the system.

Providing people with full information about the true cost of things at the point they use them is a very powerful inducement to change behaviour. Meadows gives an example of electricity meters in the front hall of a home, rather than in the basement. Another one that bugs me is the information imbalance between different transportation choices. We always know how exactly how much a trip will cost by public transit, but the cost of driving is largely invisible (paying to fill up, paying the insurance and maintenance bills, etc are too far removed from the actual per-journey decisions). Some potential fixes are very simple: Google maps could show the cost, as well as the distance & time, when doing journey planning.

#5. Change the rules of the system (incentives, punishments, constraints)

  • Climate System: Government grants for energy efficiency projects. Free public transit. Jail-time for executives whose companies break carbon emissions rules. Mandatory science comprehension testing for anyone standing for public office.
  • Financial System: Give workers the right to vote on boardroom pay rates. New regulations on what banks can and cannot do with investors’ money. Remove immunity from prosecution for politicians. Ban all private funding of political campaigns.
  • Both Systems: Strict limits on ownership of media outlets. New ethics rules for journalists and advertisers.

These changes tend to impact the behaviour of the system immediately (as long as they’re actually enforced), and hence can have very high leverage. Unfortunately, one of the problems with fixing both the climate and financial systems is that our systems for changing the rules (e.g. legislative processes) are themselves broken. Large corporations (especially fossil fuel companies) have, over a period of many years, deliberately co-opted legislative processes to meet their own goals. Where once it might have been possible for governments to pass new laws to address climate change, or to change the way governments allocate resources, now they cannot, because these processes no longer act in the interest of the people. Similarly, the mainstream media has been co-opted by the same vested interests, so that people are fed little more than propaganda about how great the system is.

#4. Nurture the power to add, change, evolve or self-organize system structure

  • Climate System: Evidence-based policymaking. Resilient communities such as Transition Towns (these empower individual communities to manage their own process of ending dependence on fossil fuels).
  • Financial System: Switch from private companies to credit unions and worker-owned cooperatives.
  • Both Systems: Change to proportional representation for elections (this gives a more diverse set of political parties access to power, and helps voters feel their vote counts). Celebrate social diversity and give greater access to political power for minorities (this removes the tendency to have one dominant culture, and hence helps build resilience).

Systems gain the ability to evolve because of diversity within them. In biology, we understand this well – the diversity of an ecosystem is essential for evolutionary processes to work. Unfortunately, few people understand this matters just as much for social systems. Societies with a single dominant culture tend to find it very hard to change, while societies that encourage and promote diversity are also laying the foundations for new ideas and new forms of self-organization to emerge.

The political culture in the US is case in point. US politics is dominated by two parties that share an almost identical set of cultural assumptions, especially to do with the capitalist system, the role of markets, and the correct way to manage the economy. This makes the US particularly resistant to change, no matter how much the evidence accumulates that the system isn’t working.

#3. Change the goal of the system

  • Climate System: Don’t focus on emission reduction, focus on eliminating each and every dependency on fossil fuels. Don’t focus on international negotiations towards a treaty, focus on zero-carbon strategies for each city or region.
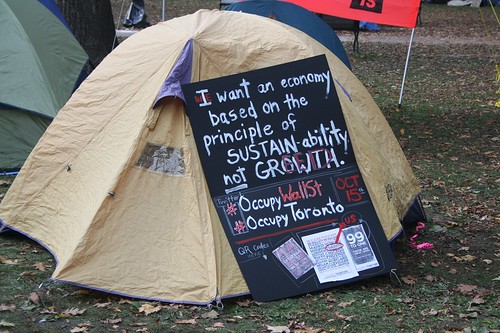
  • Financial System: Stop chasing short-term corporate profits as the primary goal of the economy. Corporations should aim for sustainability rather than growth. Instead of measuring GDP, measure gross national happiness.
  • Both Systems: Recognize and challenge the hidden goals of the current system, such as: the tendency for large corporations to maximize their power and influence over national governments; the desire to control access to information via media conglomerates; the desire of ruling elites to perpetuate their control.

Of course, changing the goal of the system is hard, because it means changing people’s perceptions of the system itself. It requires people to be able to step outside the system and see it from a fresh perspective, to identify how the dominant goals of the system shape its structure and operation. In short, it requires people to be systems thinkers.

There’s one kind of goal change related to the climate system that troubles me: instead of trying to prevent climate change, we could instead focus on survival strategies for living on a hotter planet. Given what we understand of the impacts on food, water and habitable regions, this would only be possible for a much smaller human population, and so it entails giving up trying to save as many people as possible. But it’s a very simple leverage point. The problem is that there are both ethical and practical reasons to reject this approach. The ethical reasons are well understood. The practical problem is that humans are very effective at fighting like crazy over diminishing resources, so it’s hard to see how this approach would work in the face of growing waves of climate refugees.

#2. Change the mindset or paradigm out of which the system arises

  • Climate and Financial Systems: Triple-bottom line accounting (forces companies to balance social and environmental impact with profitability). A shift in mindset from consumerism to living in harmony with the environment. A shift from material wealth as a measure of success to (say) social connectedness. A shift in mindset from individualism to community. A shift from individual greed to egalitarianism.

Paradigm shifts are hard to achieve, but when they happen, they transform the systems that arose in the previous paradigm. Much of the root cause of current problems with climate change and financial instability are due to the dominant paradigm of the last thirty years: blind faith in the free market to fix everything, along with accumulation of wealth and material assets as a virtue.

#1. The power to transcend paradigms

  • Climate and Financial Systems: Learn systems thinking and gain the ability to understand a system from multiple perspectives; Realise that system structure and behaviour arises from dominant paradigm. Explore how our own perspectives shape our interactions with the system…
  • … And then take to the streets.

Postscript: Notice that as we proceed down the list, and look at more fundamental changes to the systems, the solutions for climate change and the financial crisis start to merge. Also notice that in both cases, many of my examples aren’t what climate scientists or economists generally talk about. We need to broaden the conversation.

We’ve just announced a special issue of the Open Access Journal Geoscientific Model Development (GMD):

Call for Papers: Special Issue on Community software to support the delivery of CMIP5

CMIP5 represents the most ambitious and computer-intensive model inter-comparison project ever attempted. Integrating a new generation of Earth system models and sharing the model results with a broad community has brought with it many significant technical challenges, along with new community-wide efforts to provide the necessary software infrastructure. This special issue will focus on the software that supports the scientific enterprise for CMIP5, including: couplers and coupling frameworks for Earth system models; the Common Information Model and Controlled Vocabulary for describing models and data; The development of the Earth System Grid Federation; the development of new portals for providing data access to different end-user communities; the scholarly publishing of datasets, and studies of the software development and testing processes used for the CMIP5 models. We especially welcome papers that offer comparative studies of the software approaches taken by different groups, and lessons learnt from community efforts to create shareable software components and frameworks.

See here for submission instructions. The call is open ended, as we can keep adding papers to the special issue. We’ve solicited papers from some of the software projects involved in CMIP5, but welcome unsolicited submissions too.

GMD operates an open review process, whereby submitted papers are posted to the open discussion site (known as GMDD), so that both the invited reviewers and anyone else can make comments on the papers and then discuss such comments with the authors, prior to a final acceptance decision for the journal. I was appointed to the editorial board earlier this year, and am currently getting my first taste of how this works – I’m looking forward to applying this idea to our special issue.

We have funding for a 2-day symposium in the spring of 2012 on the topic “Sustainable Cities in a Post-Carbon World”. Here’s my current blurb for the event – I’m still tweaking the wording, so constructive comments are welcome (and watch this space for more details on date & venue, etc)…

Cities house half the world’s population, consume more than two-thirds of the world’s energy, and produce more than 70% of the global CO2 emissions. The triple threat of climate change, peak oil, and ecosystem loss poses a massive challenge to cities, as they depend on huge inputs of energy, food, and materials from the surrounding regions. Cities are also particularly vulnerable to the effects of climate change, as urban landscapes amplify extreme heat events, with potentially disastrous impact on public health and urban infrastructure.

Modern cities grew up in an era of cheap fossil fuels. As that era ends, our cities can only be sustained if they can make a rapid transition to energy efficiency and renewable fuels, and build greater resilience into their urban infrastructure. Such a transition will mean re-thinking almost every aspect of city life: buildings, lifestyle, transportation, public spaces, water and waste management, energy efficiency, social justice and participatory decision-making. The technologies that will be needed, in general, already exist. But the social and financial structures do not. The path by which rapid, wide scale deployment can occur is unclear: cities grew not so much by design, but through emergence as complex organisms. The hardest questions are not so much what a sustainable city might look like, but how we get there.

The goal of this two-day symposium is to explore new ways to bring together governments, universities and civil society to accelerate this transition to post-carbon cities. With Toronto as a model, we aim to build an action plan to engage the university with city government, NGOs, and community groups, to leverage the inter-disciplinary expertise from across campus to address this challenge.

The symposium will include a mix of talks, panel sessions, workshops, student posters, hands-on activities and movie screenings. Topics will include clean energy, smart grid, transport, urban planning, policy making, city governance, community building, data analytics, public health and green growth/economic development.

Our objectives are to develop new trans-disciplinary thinking for the transition to a post-carbon world; to build new collaborations; and to better integrate current research with urban policy, leading to solutions for sustainable urban development.