
At the beginning of March, I was invited to give a talk at TEDxUofT. Colleagues tell me the hardest part of giving these talks is deciding what to talk about. I decided to see if I could answer the question of whether we can trust climate models. It was a fascinating and nerve-wracking experience, quite unlike any talk I’ve given before. Of course, I’d love to do another one, as I now know more about what works and what doesn’t.
Here’s the video and a transcript of my talk. [The bits in square brackets in are things I intended to say but forgot!]
Computing the Climate: How Can a Computer Model Forecast the Future? TEDxUofT, March 1, 2014.
Talking about the weather forecast is a great way to start a friendly conversation. The weather forecast matters to us. It tells us what to wear in the morning; it tells us what to pack for a trip. We also know that weather forecasts can sometimes be wrong, but we’d be foolish to ignore them when they tell us a major storm is heading our way.
[Unfortunately, talking about climate forecasts is often a great way to end a friendly conversation!] Climate models tell us that by the end of this century, if we carry on burning fossil fuels at the rate we have been doing, and we carry on cutting down forests at the rate we have been doing, the planet will warm by somewhere between 5 to 6 degrees centigrade. That might not seem much, but, to put it into context, in the entire history of human civilization, the average temperature of the planet has not varied by more than 1 degree. So that forecast tells us something major is coming, and we probably ought to pay attention to it.
But on the other hand, we know that weather forecasts don’t work so well the longer into the future we peer. Tomorrow’s forecast is usually pretty accurate. Three day and five day forecasts are reasonably good. But next week? They always change their minds before next week comes. So how can we peer 100 years into the future and look at what is coming with respect to the climate? Should we trust those forecasts? Should we trust the climate models that provide them to us?
Six years ago, I set out to find out. I’m a professor of computer science. I study how large teams of software developers can put together complex pieces of software. I’ve worked with NASA, studying how NASA builds the flight software for the Space Shuttle and the International Space Station. I’ve worked with large companies like Microsoft and IBM. My work focusses not so much on software errors, but on the reasons why people make those errors, and how programmers then figure out they’ve made an error, and how they know how to fix it.
To start my study, I visited four major climate modelling labs around the world: in the UK, in Paris, Hamburg, Germany and in Colorado. Each of these labs have typically somewhere between 50-100 scientists who are contributing code to their climate models. And although I only visited four of these labs, there are another twenty or so around the world, all doing similar things. They run these models on some of the fastest supercomputers in the world, and many of the models have been in construction, the same model, for more than 20 years.
When I started this study, I asked one of my students to attempt to measure how many bugs there are in a typical climate model. We know from our experience with software there are always bugs. Sooner or later the machine crashes. So how buggy are climate models? More specifically, what we set out to measure is what we call “defect density” – How many errors are there per thousand lines of code. By this measure, it turns out climate models are remarkably high quality. In fact, they’re better than almost any commercial software that’s ever been studied. They’re about the same level of quality as the Space Shuttle flight software. Here’s my results (For the actual results you’ll have to read the paper):
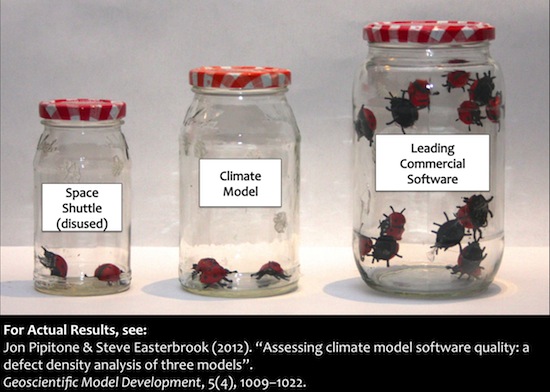
We know it’s very hard to build a large complex piece of software without making mistakes. Even the space shuttle’s software had errors in it. So the question is not “is the software perfect for predicting the future?”. The question is “Is it good enough?” Is it fit for purpose?
To answer that question, we’d better understand what that purpose of a climate model is. First of all, I’d better be clear what a climate model is not. A climate model is not a projection of trends we’ve seen in the past extrapolated into the future. If you did that, you’d be wrong, because you haven’t accounted for what actually causes the climate to change, and so the trend might not continue. They are also not decision-support tools. A climate model cannot tell us what to do about climate change. It cannot tell us whether we should be building more solar panels, or wind farms. It can’t tell us whether we should have a carbon tax. It can’t tell us what we ought to put into an international treaty.
What it does do is tell us how the physics of planet earth work, and what the consequences are of changing things, within that physics. I could describe it as “computational fluid dynamics on a rotating sphere”. But computational fluid dynamics is complex.
I went into my son’s fourth grade class recently, and I started to explain what a climate model is, and the first question they asked me was “is it like Minecraft?”. Well, that’s not a bad place to start. If you’re not familiar with Minecraft, it divides the world into blocks, and the blocks are made of stuff. They might be made of wood, or metal, or water, or whatever, and you can build things out of them. There’s no gravity in Minecraft, so you can build floating islands and it’s great fun.
Climate models are a bit like that. To build a climate model, you divide the world into a number of blocks. The difference is that in Minecraft, the blocks are made of stuff. In a climate model, the blocks are really blocks of space, through which stuff can flow. At each timestep, the program calculates how much water, or air, or ice is flowing into, or out of, each block, and if so, in which directions? It calculates changes in temperature, density, humidity, and so on. And whether stuff such as dust, salt, and pollutants are passing through or accumulating in each block. We have to account for the sunlight passing down through the block during the day. Some of what’s in each block might filter some of the the incoming sunlight, for example if there are clouds or dust, so some of the sunlight doesn’t get down to the blocks below. There’s also heat escaping upwards through the blocks, and again, some of what is in the block might trap some of that heat — for example clouds and greenhouse gases.
As you can see from this diagram, the blocks can be pretty large. The upper figure shows blocks of 87km on a side. If you want more detail in the model, you have to make the blocks smaller. Some of the fastest climate models today look more like the lower figure:

Ideally, you want to make the blocks as small as possible, but then you have many more blocks to keep track of, and you get to the point where the computer just can’t run fast enough. A typical run of a climate model, to simulate a century’s worth of climate, you might have to wait a couple of weeks on some of the fastest supercomputers for that run to complete. So the speed of the computer limits how small we can make the blocks.
Building models this way is remarkably successful. Here’s video of what a climate model can do today. This simulation shows a year’s worth of weather from a climate model. What you’re seeing is clouds and, in orange, that’s where it’s raining. Compare that to a year’s worth of satellite data for the year 2013. If you put them side by side, you can see many of the same patterns. You can see the westerlies, the winds at the top and bottom of the globe, heading from west to east, and nearer the equator, you can see the trade winds flowing in the opposite direction. If you look very closely, you might even see a pulse over South America, and a similar one over Africa in both the model and the satellite data. That’s the daily cycle as the land warms up in the morning and the moisture evaporates from soils and plants, and then later on in the afternoon as it cools, it turns into rain.
Note that the bottom is an actual year, 2013, while the top, the model simulation is not a real year at all – it’s a typical year. So the two don’t correspond exactly. You won’t get storms forming at the same time, because it’s not designed to be an exact simulation; the climate model is designed to get the patterns right. And by and large, it does. [These patterns aren’t coded into this model. They emerge as a consequences of getting the basic physics of the atmosphere right].
So how do you build a climate model like this? The answer is “very slowly”. It takes a lot of time, and a lot of failure. One of the things that surprised me when I visited these labs is that the scientists don’t build these models to try and predict the future. They build these models to try and understand the past. They know their models are only approximations, and they regularly quote the statistician, George Box, who said “All models are wrong, but some are useful”. What he meant is that any model of the world is only an approximation. You can’t get all the complexity of the real world into a model. But even so, even a simple model is a good way to test your theories about the world.
So the way that modellers work, is they spend their time focussing on places where the model does isn’t quite right. For example, maybe the model isn’t getting the Indian monsoon right. Perhaps it’s getting the amount of rain right, but it’s falling in the wrong place. They then form a hypothesis. They’ll say, I think I can improve the model, because I think this particular process is responsible, and if I improve that process in a particular way, then that should fix the simulation of the monsoon cycle. And then they run a whole series of experiments, comparing the old version of the model, which is getting it wrong, with the new version, to test whether the hypothesis is correct. And if after a series of experiments, they believe their hypothesis is correct, they have to convince the rest of the modelling team that this really is an improvement to the model.
In other words, to build the models, they are doing science. They are developing hypotheses, they are running experiments, and using peer review process to convince their colleagues that what they have done is correct:

Climate modellers also have a few other weapons up their sleeves. Imagine for a moment if Microsoft had 25 competitors around the world, all of whom were attempting to build their own versions of Microsoft Word. Imagine further that every few years, those 25 companies all agreed to run their software on a very complex battery of tests, designed to test all the different conditions under which you might expect a word processor to work. And not only that, but they agree to release all the results of those tests to the public, on the internet, so that anyone who wanted to use any of that software can pore over all the data and find out how well each version did, and decide which version they want to use for their own purposes. Well, that’s what climate modellers do. There is no other software in the world for which there are 25 teams around the world trying to build the same thing, and competing with each other.
Climate modellers also have some other advantages. In some sense, climate modelling is actually easier than weather forecasting. I can show you what I mean by that. Imagine I had a water balloon (actually, you don’t have to imagine – I have one here):

I’m going to throw it at the fifth row. Now, you might want to know who will get wet. You could measure everything about my throw: Will I throw underarm, or overarm? Which way am I facing when I let go of it? How much swing do I put in? If you could measure all of those aspects of my throw, and you understand the physics of how objects move, you could come up with a fairly accurate prediction of who is going to get wet.
That’s like weather forecasting. We have to measure the current conditions as accurately as possible, and then project forward to see what direction it’s moving in:

If I make any small mistakes in measuring my throw, those mistakes will multiply as the balloon travels further. The further I attempt to throw it, the more room there is for inaccuracy in my estimate. That’s like weather forecasting. Any errors in the initial conditions multiply up rapidly, and the current limit appears to be about a week or so. Beyond that, the errors get so big that we just cannot make accurate forecasts.
In contrast, climate models would be more like releasing a balloon into the wind, and predicting where it will go by knowing about the wind patterns. I’ll make some wind here using a fan:
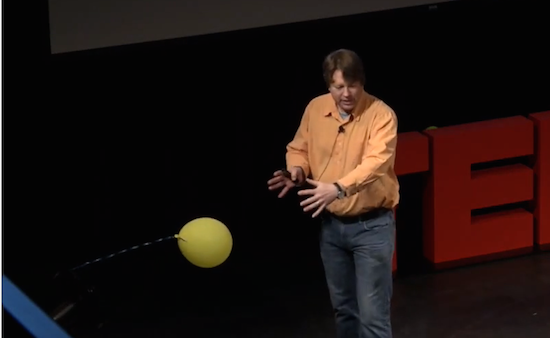
Now that balloon is going to bob about in the wind from the fan. I could go away and come back tomorrow and it will still be doing about the same thing. If the power stays on, I could leave it for a hundred years, and it might still be doing the same thing. I won’t be able to predict exactly where that balloon is going to be at any moment, but I can predict, very reliably, the space in which it will move. I can predict the boundaries of its movement. And if the things that shape those boundaries change, for example by moving the fan, and I know what the factors are that shape those boundaries, I can tell you how the patterns of its movements are going to change – how the boundaries are going to change. So we call that a boundary problem:

The initial conditions are almost irrelevant. It doesn’t matter where the balloon started, what matters is what’s shaping its boundary.
So can these models predict the future? Are they good enough to predict the future? The answer is “yes and no”. We know the models are better at some things than others. They’re better at simulating changes in temperature than they are at simulating changes in rainfall. We also know that each model tends to be stronger in some areas and weaker in others. If you take the average of a whole set of models, you get a much better simulation of how the planet’s climate works than if you look at any individual model on its own. What happens is that the weaknesses in any one model are compensated for by other models that don’t have those weaknesses.
But the results of the models have to be interpreted very carefully, by someone who knows what the models are good at, and what they are not good at – you can’t just take the output of a model and say “that’s how it’s going to be”.
Also, you don’t actually need a computer model to predict climate change. The first predictions of what would happen if we keep on adding carbon dioxide to the atmosphere were produced over 120 years ago. That’s fifty years before the first digital computer was invented. And those predictions were pretty accurate – what has happened over the twentieth century has followed very closely what was predicted all those years ago. Scientists also predicted, for example, that the arctic would warm faster than the equatorial regions, and that’s what happened. They predicted night time temperatures would rise faster than day time temperatures, and that’s what happened.
So in many ways, the models only add detail to what we already know about the climate. They allow scientists to explore “what if” questions. For example, you could ask of a model, what would happen if we stop burning all fossil fuels tomorrow. And the answer from the models is that the temperature of the planet will stay at whatever temperature it was when you stopped. For example, if we wait twenty years, and then stopped, we’re stuck with whatever temperature we’re at for tens of thousands of years. You could ask a model what happens if we dig up all known reserves of fossil fuels, and burn them all at once, in one big party? Well, it gets very hot.
More interestingly, you could ask what if we tried blocking some of the incoming sunlight to cool the planet down, to compensate for some of the warming we’re getting from adding greenhouse gases to the atmosphere? There have been a number of very serious proposals to do that. There are some who say we should float giant space mirrors. That might be hard, but a simpler way of doing it is to put dust up in the stratosphere, and that blocks some of the incoming sunlight. It turns out that if you do that, you can very reliably bring the average temperature of the planet back down to whatever level you want, just by adjusting the amount of the dust. Unfortunately, some parts of the planet cool too much, and others not at all. The crops don’t grow so well, and everyone’s weather gets messed up. So it seems like that could be a solution, but when you study the model results in detail, there are too many problems.
Remember that we know fairly well what will happen to the climate if we keep adding CO2, even without using a computer model, and the computer models just add detail to what we already know. If the models are wrong, they could be wrong in either direction. They might under-estimate the warming just as much as they might over-estimate it. If you look at how well the models can simulate the past few decades, especially the last decade, you’ll see some of both. For example, the models have under-estimated how fast the arctic sea ice has melted. The models have underestimated how fast the sea levels have risen over the last decade. On the other hand, they over-estimated the rate of warming at the surface of the planet. But they underestimated the rate of warming in the deep oceans, so some of the warming ends up in a different place from where the models predicted. So they can under-estimate just as much as they can over-estimate. [The less certain we are about the results from the models, the bigger the risk that the warming might be much worse than we think.]
So when you see a graph like this, which comes from the latest IPCC report that just came out last month, it doesn’t tell us what to do about climate change, it just tells us the consequences of what we might choose to do. Remember, humans aren’t represented in the models at all, except in terms of us producing greenhouse gases and adding them to the atmosphere.

If we keep on increasing our use of fossil fuels — finding more oil, building more pipelines, digging up more coal, we’ll follow the top path. And that takes us to a planet that by the end of this century, is somewhere between 4 and 6 degrees warmer, and it keeps on getting warmer over the next few centuries. On the other hand, the bottom path, in dark blue, shows what would happen if, year after year from now onwards, we use less fossil fuels than we did the previous year, until about mid-century, when we get down to zero emissions, and we invent some way to start removing that carbon dioxide from the atmosphere before the end of the century, to stay below 2 degrees of warming.
The models don’t tell us which of these paths we should follow. They just tell us that if this is what we do, here’s what the climate will do in response. You could say that what the models do is take all the data and all the knowledge we have about the climate system and how it works, and put them into one neat package, and its our job to take that knowledge and turn it into wisdom. And to decide which future we would like.
“… invent some way to start removing that carbon dioxide from the atmosphere before the end of the century” — we are fortunate in that this has already been done. Links at http://discussion.theguardian.com/comment-permalink/35958890
… and one minor thing … it’s “pore all over the data”, or “pore over all the data”, but not, I think, “pour”. Scrutiny is not a liquid.
@grlcowan: Well you learn something new every day. It is indeed pore, meaning to examine closely. And there was me thinking that we were indeed pouring our scrutiny over stuff.
Thanks for this talk, Steve!
There were so many great things about it. You helped make a process that seems in the realm of these highly intelligent experts feel more tangible to me, and you highlight the challenges of modeling in very clear language and illustrations.
I liked that you were able to touch upon such a broad range of topics in your ultimate question of whether climate models, building up some background domain knowledge just enough so a reader could understand the foundational pieces before getting to your question.
I found many pieces that could certainly be their own talks/posts:
– that all models risk having bugs
– philosophical explanation of climate (SD) modeling and that they are not just extrapolations of the past into the future
– how climate modeling actually works (Nice Minecraft analogy and I loved the visuals of using smaller vs. larger blocks and the additional context of how long it takes our supercomputers to run simulations)
– the Modeling Process itself and how new hypotheses surface
– what the outputs of these models look like
– what these models actually aim to do – help us understand what could happen.
Terrific Ted Talk!
I love the tethered balloon metaphor Steve -I hope you don’t mind educators borrowing it from you?
I have a question regarding the modelling of surface, compared with ocean, temperatures -is there a version of a GCM which models all energy uptake as a standard unit? And is there a convention of measurement which would allow such a model to be compared with observations?
By the way, I see what would be fair to describe as people pouring over data all the time, but not in any of the places on your blog roll 🙂
There’s Carbon Engineering in Calgary;
http://carbonengineering.com/
http://www.nytimes.com/2013/01/06/business/pilot-plant-in-the-works-for-carbon-dioxide-cleansing.html
They use air capture, and it can be implemented anywhere. I don’t think this technology is very cheap to run.
“If we keep on increasing our use of fossil fuels — finding more oil, building more pipelines, digging up more coal, we’ll follow the top path.”
And how do you know that?
[snip – trolling is not acceptable here]
@Mark: Good question! The four different pathways (RCPs) were selected as representative of four different futures. The top two represent the upper and lower limit of likely fossil fuel emissions with no coordinated climate policy, while the lower two represent the upper and lower limit of likely emissions with a coordinated global climate policy. See here for more information on how these pathways were selected:
http://www.easterbrook.ca/steve/2011/09/the-cmip5-climate-experiments/
BTW I removed the rest of your comment, as it violates my moderation policy. From your tone, I suspect you’re not interested in the answer to your question, but others might be, so thanks for asking!
@steve,
You wrote, “If we keep on increasing our use of fossil fuels — finding more oil, building more pipelines, digging up more coal, we’ll follow the top path.”
I asked, “And how do you know that?”
You responded, “The four different pathways (RCPs) were selected as representative of four different futures. The top two represent the upper and lower limit of likely fossil fuel emissions with no coordinated climate policy.”
But my question was how you knew that “we’ll follow the top path” (RCP8.5)? For instance, RCP8.5 has coal usage that increases throughout the 21st century, such that emissions in 2100 will be nearly 10 times higher than they were in 2000:
http://link.springer.com/article/10.1007%2Fs10584-011-0149-y#
How do you know that’s a reasonable assessment? For example, if I said that world coal consumption is likely to be lower than what it was in the year 2000 in the year 2100, how would you know that was wrong, and that the value in 2100 was more likely to be approximately 10 times higher than in 2000, as the IPCC RCP8.5 scenario indicates?
@Mark: Nobody knows that. That’s the point. I said these are “what-if” experiments. IF we follow that path, and keep increasing use of fossil fuels over the coming century, the models tell us how the climate system will respond. As I said at the end of the talk, we have a choice over which path we should follow.
Pingback: Kan vi stole på klimamodeller? | Mot normalt
@Steve: I’m getting the impression that you’re not interested in serious discussion of whether or not the IPCC’s RCP8.5 scenario is a realistic representation of what is likely to happen in the 21st century and beyond in a “do nothing” or “business as usual” scenario.
But in case my impression is wrong, here are two good discussions of whether the RCP8.5 scenario is realistic, especially with regard to coal usage:
http://judithcurry.com/2014/04/22/coal-and-the-ipcc/
http://dx.doi.org/10.1016/j.enpol.2012.10.046
@Mark: alternatively, it might be just that I have better things to do with my time than play whack-a-mole with tired old denialist talking points. The blog post you link to is just silly. The paper is a critique of the old SRES scenarios, not the new RCPs. Remember that RCP8.5 represents the upper 95% confidence interval on likely BAU scenarios. It’s plausible, but only just. RCP6.0 represents the lower 95% confidence interval. So the likely “no policy” future is somewhere between them. I suggest you read up carefully on how these pathways were created and reviewed before you try knocking them down.
I did my own back-of-the-envelope calculations, based just on known reserves (no accounting for new discoveries). There’s more than enough fossil fuels to cause dangerous climate change:
http://www.easterbrook.ca/steve/2009/11/will-peak-oil-save-us-from-climate-change/
This stuff is really not hard to check for yourself. Don’t take the crap at Curry’s blog at face value. Unless you have something really substantial to add, I suggest we devote our time to more useful questions.
One more thought (maybe Mark’s talking points are useful after all). It’s very tempting to believe that fossil fuels running out might save us from climate change, even though the numbers say otherwise. But it doesn’t really matter anyway, because the solution is the same in both cases: aggressive global policies to get us off fossil fuels as fast as possible. Waiting till we pass peak coal to do anything about replacing it will be a disaster for the economy. It will also be a disaster for the climate. So which ever line of argument you prefer, a global strategy to phase out fossil fuel use is essential.
Nice talk. I have a comment.
When you describe ensemble averaging you write: “What happens is that the weaknesses in any one model are compensated for by other models that don’t have those weaknesses.” There is certainly some truth in this, but I am not so confident that this would work for structural model errors, i.e. errors in the science. All models may be missing something in their science, something we don’t know. (Although we do not know what it is, I like to think of some defect in the description of clouds and radiation, or some essential processes in soil biology, or some slow variations in the deep ocean circulation, or whatever.) Remember it is not just basic physics, but an awful lot of parametrisations and then also the biogeochemistry that matter. So it is conceivable, that all current models miss something, and this might introduce a bias. Do you agree?
Another point: someone has to decide which models one should retain for the ensemble averaging, and which models should be excluded because they are not good enough. It is my experience that different scientists make different choices in such a situation, and this will affect the ensemble mean. What’s your view on this?
“Climate models tell us that by the end of this century, if we carry on burning fossil fuels at the rate we have been doing, and we carry on cutting down forests at the rate we have been doing, the planet will warm by somewhere between 5 to 6 degrees centigrade.”
This is not supported by your AR5 figure, even for the RCP8.5 scenario which you describe as “the upper 95% confidence interval on likely BAU scenarios.”
Hi,
I see my comments of June 25th are still “awaiting moderation.” They seem pretty moderate to me.
Mark
Gerbrand: You’re quite correct – the ensemble approach doesn’t work if there are structural errors in the model. There’s some evidence that the models aren’t as independent from one another as they ought to be (e.g. see the work by Knutti on this: http://pubs.amstat.org/doi/abs/10.1198/016214507000001265). However, I do find it remarkable that the multi-model ensemble works as well as it does for simulating both 20th Century and pre-industrial climates.
For more on this point, check out some of my earlier posts:
http://www.easterbrook.ca/steve/2011/11/one-model-to-rule-them-all/
http://www.easterbrook.ca/steve/2011/05/workshop-on-advancing-climate-modeling-3/
http://www.easterbrook.ca/steve/2010/01/agu-day-3-part-c-how-good-are-predictions-from-climate-models/
Harold: My summary is correct. Look closely at the figure. The zero on the Y-axis is the average global temperature for the last quarter of the 20th Century, a point at which some warming had already occurred. So to get the increase over pre-industrial temperatures, you have to add about 1°C. So 5-6°C is a reasonable summary of the spread of model projections for the end of this century, with further rises over the following centuries.
BTW this type of nitpicking is particularly pointless. The model spread is big enough so that if you pick a particular model as “the best”, by whatever criteria, you can get an answer anywhere from +4°C to +7°C by the end of this century. Nobody can say for sure what the difference between these two results would mean for humanity, but we know for sure that any of these scenarios would result in a very different planet from the one human civilization evolved on. Over the entire history of human civilization, the global average temperature has not changed my more than 1°C. We’re taking an incredible and unprecedented risk with our planetary life-support system.
Mark,
Come back when you:
a) Have read the report on how the representative pathways were selected (See: http://www.ipcc.ch/pdf/supporting-material/expert-meeting-ts-scenarios.pdf);
b) Have read my moderation policy; and
c) Have something new and interesting to say.
Steve: Before I retired I worked for many years developing complex, multi-physics non-linear codes. During that time (when I had the time -rarely), I would spend some time stressing the code. For example, it is easy to use a debugger to perturb a particular quantity and then observe how it compares to unperturbed results. In this way, we could get a handle on the propagation of roundoff error. Doing this we were quite disturbed to discover that the mere placement of parentheses could have in some cases dramatic effects. We would also examine the sensitivity to initial conditions. We expect the code results to be chaotic in some variables. One would hope that some integrated variables were less so. I suspect that such analyses have improved a good deal since I retired, but I’m wondering whether climate codes customarily go through these kinds of exercises.